Home >>STATISTICS, Section 1, normal distribution 2
first principles |
Combinations nCr
To appreciate the Binomial equation we must first have an understanding of Combinations.
The definition of a Combination is:
'the number of ways r items can be chosen from a set of n items'
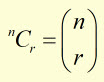
A short-hand way of writing this is nCr .
This can be written mathematically as:
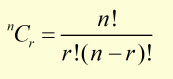
*note ! means 'factorial' - eg !3 = 3 x 2 x 1
It must be emphasized that an easier method of calculation, especially with large values of n, is to use a calculator.
Example
With 52 cards in a deck, how many ways can 3 different cards be chosen?
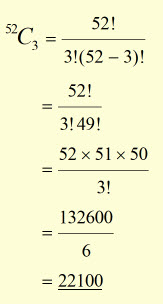
Using a calculator,
52 SHIFT nCr 3 = 22100
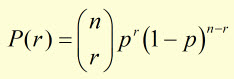
The Binomial Equation
![]()
where the probability of failure,
![]()
Since,
and
![]()
the Binomial equation is sometimes expressed as:
Example
Using the problem first given in Binomial distribution part 1 and extending it to probability prediction:
1 ball is chosen from a bag of 10 identical balls, each numbered (1-10). Once noted, the ball is returned to the bag.
A single ball is chosen on 3 separate occasions.
Success is in obtaining a '5' ball.
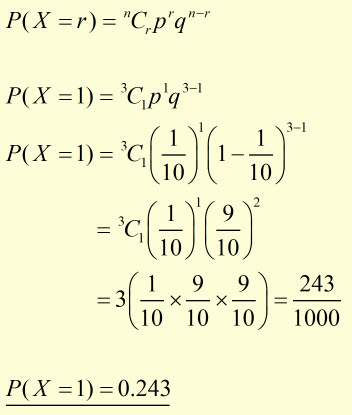
i) What is the probability of obtaining a single '5' ball in 3 choices?
ii) Draw a tree-diagram to find the probability of obtaining a single '5' ball in the last choice.
i)
Let X be the random variable for obtaining a '5' ball.
X has possible values (0, 1, 2, 3).
The number of trials n = 3 .
The number of required successes r = 1 .
p probability of single successful trial (ie a '5' ball) = 1/10
ii)

The probability(P) of getting a '5' ball with 3 tries is the sum of each of the probabilities for each successful attempt.
The sum sign '+' signifies an 'OR' decision.
The multiplication sign 'x' signifies the AND condition.
P = (q x q x p) + (q x p x q) + (p x q x q)
So the probability PL of the last ball drawn being a '5' is given by:
PL = (q x q x p) = (9/10) (9/10) (1/10) = 81/1000 = 0.081
[ About ] [ FAQ ] [ Links ] [ Terms & Conditions ] [ Privacy ] [ Site Map ] [ Contact ]